DevOps Project-38: End-to-End Deployment of a FullStack Blogging Application with AWS EKS, Terraform, Jenkins, SonarQube, Nexus, Trivy & Prometheus/Grafana
- Authors

- Name
- NotHarshhaa
- GitHub
(A Spring Boot Application Deployed on AWS with EKS, Terraform, Jenkins, SonarQube, Nexus, Trivy & Prometheus/Grafana)
Project Overview
A production-ready Full-stack Blogging Application built with Java (Spring Boot), Docker, and Kubernetes — fully automated using modern DevOps tools. This app supports posting, editing, and managing blogs with continuous delivery and security integration.
Features
Create, Edit, and Delete Blog Posts
RESTful API using Spring Boot (Java)
Static Code Analysis with SonarQube
Vulnerability Scanning with Trivy
Automated Build, Test, and Deploy Pipeline
Kubernetes Deployment on AWS EKS
Containerized using Docker
CI/CD with Jenkins
Secure Artifact Management via Nexus
Email Notifications on Deployment via Jenkins
Login Page
Press enter or click to view image in full size
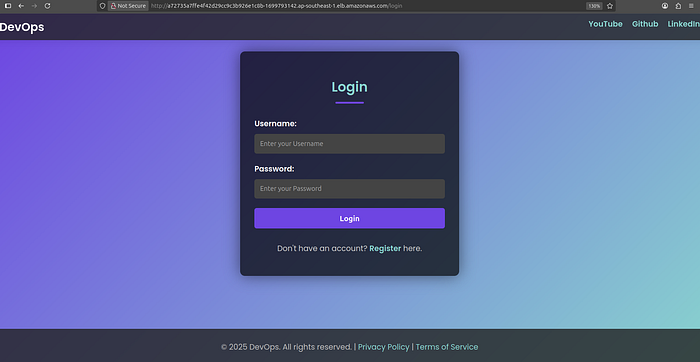
Login Page
Home Page
Press enter or click to view image in full size
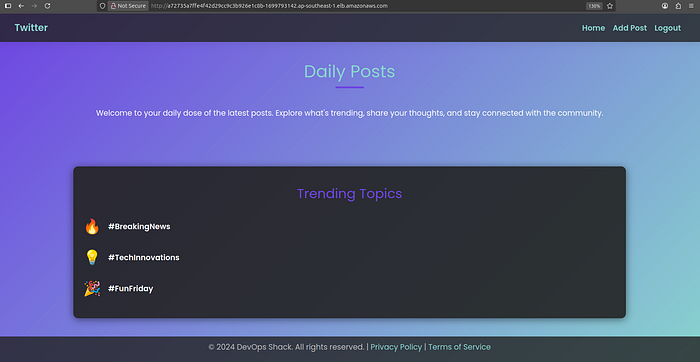
Home Page
Status Post
Press enter or click to view image in full size
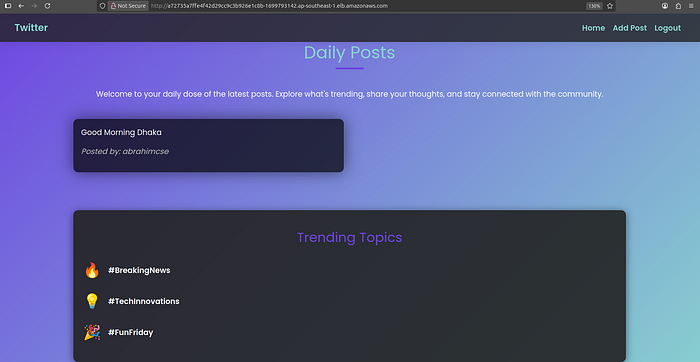
Status Post
☁️ DevOps & Deployment
Docker
Kubernetes
AWS EKS (Elastic Kubernetes Service)
Terraform (for Infrastructure as Code)
Jenkins (CI/CD pipeline)
Nexus (Artifact Repository)
SonarQube (Code Quality Check)
Trivy (Container Image Scanning)
Gmail SMTP (Jenkins Email Notification)
Monitoring (Prometheus,BlackBox,Node Exporter and Grafana)
Infrastructure & Installation (AWS EC2 + K8s + DevOps Tools)
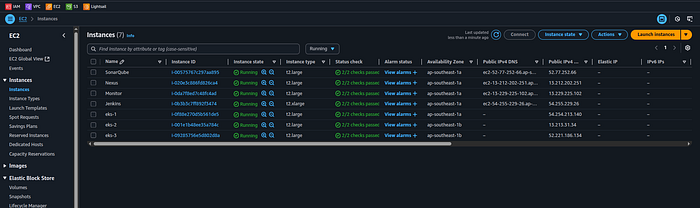
1. AWS Setup
Default vpc
Security Group: Default SG with port 8 open
Create Instancess 7 (t2.medium, 25gb)
Master Node
Slave-1
Slave-2
SonarQube
Nexus
Monitor
Jenkins (t2 large,30)
Press enter or click to view image in full size
Setup AWS EKS Cluster by Terraform
1. AWS CLI Install
Donload and install AWS CLI for connect with aws cloud
curl "https://awscli.amazonaws.com/awscli-exe-linux-x86_64.zip" -o "awscliv2.zip"
unzip awscliv2.zip
sudo ./aws/install
aws --version
Expected output:
aws-cli/2.x.x Python/3.x.x Linux/...
2. Configure AWS CLI
You need AWS credentials to use the CLI. Run:
aws configure
Provide the following when prompted:
AWS Access Key ID
AWS Secret Access Key
Default region (e.g.
ap-southeast-1)Output format (
jsonrecommended)
3. Terraform Installation on Ubuntu
Method 1: Official APT Repository (Recommended for Production)
# Install prerequisites
sudo apt install -y gnupg software-properties-common curl
# Add HashiCorp GPG key
curl -fsSL https://apt.releases.hashicorp.com/gpg | sudo gpg --dearmor -o /usr/share/keyrings/hashicorp-archive-keyring.gpg
# Add the official HashiCorp Linux repo
echo "deb [signed-by=/usr/share/keyrings/hashicorp-archive-keyring.gpg] https://apt.releases.hashicorp.com $(lsb_release -cs) main" | \
sudo tee /etc/apt/sources.list.d/hashicorp.list
# Update and install Terraform
sudo apt update
sudo apt install terraform -y
# Verify installation
terraform -version
Method 2: Snap (Quick Setup, Not Always Latest Version)
sudo snap install terraform --classic
4. EKS Cluster Create by Terraform
Terraform Folder create
mkdir terra
cd terra
Terraform File Create
- Main File create
vim main.tf
Copy configure file
provider "aws" {
  region = "ap-southeast-1"
}
resource "aws_vpc" "abrahimcse_vpc" {
  cidr_block = "10.0.0.0/16"
  tags = {
    Name = "abrahimcse-vpc"
  }
}
resource "aws_subnet" "abrahimcse_subnet" {
  count = 2
  vpc_id                  = aws_vpc.abrahimcse_vpc.id
  cidr_block              = cidrsubnet(aws_vpc.abrahimcse_vpc.cidr_block, 8, count.index)
  availability_zone       = element(["ap-southeast-1a", "ap-southeast-1b"], count.index)
  map_public_ip_on_launch = true
  tags = {
    Name = "abrahimcse-subnet-${count.index}"
  }
}
resource "aws_internet_gateway" "abrahimcse_igw" {
  vpc_id = aws_vpc.abrahimcse_vpc.id
  tags = {
    Name = "abrahimcse-igw"
  }
}
resource "aws_route_table" "abrahimcse_route_table" {
  vpc_id = aws_vpc.abrahimcse_vpc.id
  route {
    cidr_block = "0.0.0.0/0"
    gateway_id = aws_internet_gateway.abrahimcse_igw.id
  }
  tags = {
    Name = "abrahimcse-route-table"
  }
}
resource "aws_route_table_association" "a" {
  count          = 2
  subnet_id      = aws_subnet.abrahimcse_subnet[count.index].id
  route_table_id = aws_route_table.abrahimcse_route_table.id
}
resource "aws_security_group" "abrahimcse_cluster_sg" {
  vpc_id = aws_vpc.abrahimcse_vpc.id
  egress {
    from_port   = 0
    to_port     = 0
    protocol    = "-1"
    cidr_blocks = ["0.0.0.0/0"]
  }
  tags = {
    Name = "abrahimcse-cluster-sg"
  }
}
resource "aws_security_group" "abrahimcse_node_sg" {
  vpc_id = aws_vpc.abrahimcse_vpc.id
  ingress {
    from_port   = 0
    to_port     = 0
    protocol    = "-1"
    cidr_blocks = ["0.0.0.0/0"]
  }
  egress {
    from_port   = 0
    to_port     = 0
    protocol    = "-1"
    cidr_blocks = ["0.0.0.0/0"]
  }
  tags = {
    Name = "abrahimcse-node-sg"
  }
}
resource "aws_eks_cluster" "abrahimcse" {
  name     = "abrahimcse-cluster"
  role_arn = aws_iam_role.abrahimcse_cluster_role.arn
  vpc_config {
    subnet_ids         = aws_subnet.abrahimcse_subnet[*].id
    security_group_ids = [aws_security_group.abrahimcse_cluster_sg.id]
  }
}
resource "aws_eks_node_group" "abrahimcse" {
  cluster_name    = aws_eks_cluster.abrahimcse.name
  node_group_name = "abrahimcse-node-group"
  node_role_arn   = aws_iam_role.abrahimcse_node_group_role.arn
  subnet_ids      = aws_subnet.abrahimcse_subnet[*].id
  scaling_config {
    desired_size = 3
    max_size     = 3
    min_size     = 3
  }
  instance_types = ["t2.large"]
  remote_access {
    ec2_ssh_key = var.ssh_key_name
    source_security_group_ids = [aws_security_group.abrahimcse_node_sg.id]
  }
}
resource "aws_iam_role" "abrahimcse_cluster_role" {
  name = "abrahimcse-cluster-role"
  assume_role_policy = <<EOF
{
  "Version": "2012-10-17",
  "Statement": [
    {
      "Effect": "Allow",
      "Principal": {
        "Service": "eks.amazonaws.com"
      },
      "Action": "sts:AssumeRole"
    }
  ]
}
EOF
}
resource "aws_iam_role_policy_attachment" "abrahimcse_cluster_role_policy" {
  role       = aws_iam_role.abrahimcse_cluster_role.name
  policy_arn = "arn:aws:iam::aws:policy/AmazonEKSClusterPolicy"
}
resource "aws_iam_role" "abrahimcse_node_group_role" {
  name = "abrahimcse-node-group-role"
  assume_role_policy = <<EOF
{
  "Version": "2012-10-17",
  "Statement": [
    {
      "Effect": "Allow",
      "Principal": {
        "Service": "ec2.amazonaws.com"
      },
      "Action": "sts:AssumeRole"
    }
  ]
}
EOF
}
resource "aws_iam_role_policy_attachment" "abrahimcse_node_group_role_policy" {
  role       = aws_iam_role.abrahimcse_node_group_role.name
  policy_arn = "arn:aws:iam::aws:policy/AmazonEKSWorkerNodePolicy"
}
resource "aws_iam_role_policy_attachment" "abrahimcse_node_group_cni_policy" {
  role       = aws_iam_role.abrahimcse_node_group_role.name
  policy_arn = "arn:aws:iam::aws:policy/AmazonEKS_CNI_Policy"
}
resource "aws_iam_role_policy_attachment" "abrahimcse_node_group_registry_policy" {
  role       = aws_iam_role.abrahimcse_node_group_role.name
  policy_arn = "arn:aws:iam::aws:policy/AmazonEC2ContainerRegistryReadOnly"
}
- Variable file create
vim variable.tf
copy and past
variable "ssh_key_name" {
  description = "The name of the SSH key pair to use for instances"
  type        = string
  default     = "hsms-stg-common"
}
- Output File Create
vim output.tf
copy and past
output "cluster_id" {
  value = aws_eks_cluster.abrahimcse.id
}
output "node_group_id" {
  value = aws_eks_node_group.abrahimcse.id
}
output "vpc_id" {
  value = aws_vpc.abrahimcse_vpc.id
}
output "subnet_ids" {
  value = aws_subnet.abrahimcse_subnet[*].id
}
- Run Terraform File for create eks
terraform init
terraform plan
terraform validate
terraform apply --auto-approve
Press enter or click to view image in full size
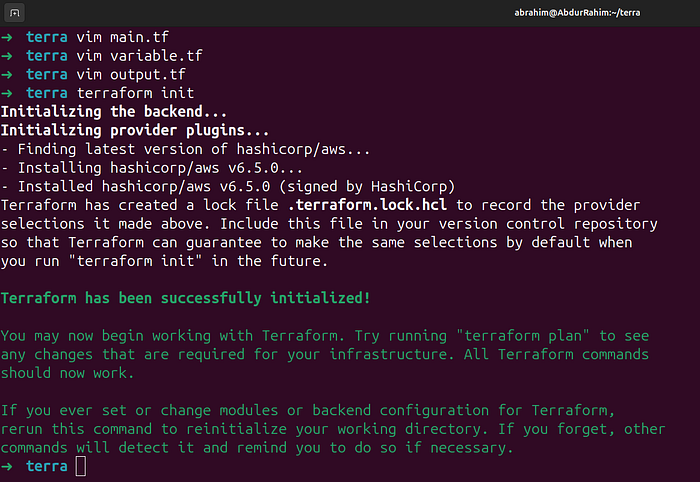
Initialized
EKS Create
Press enter or click to view image in full size
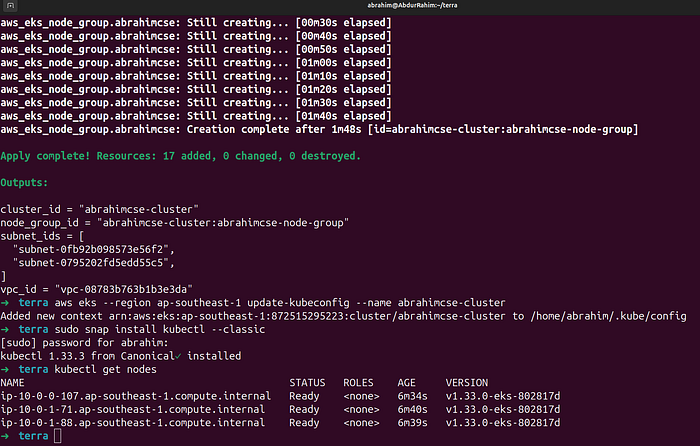
EKS Create
- Connect with EKS Cluster
aws eks --region ap-southeast-1 update-kubeconfig --name abrahimcse-cluster
- Install Kubect and check nodes
sudo snap install kubectl --classic
kubectl get nodes
AWS EKS Cluster
Press enter or click to view image in full size
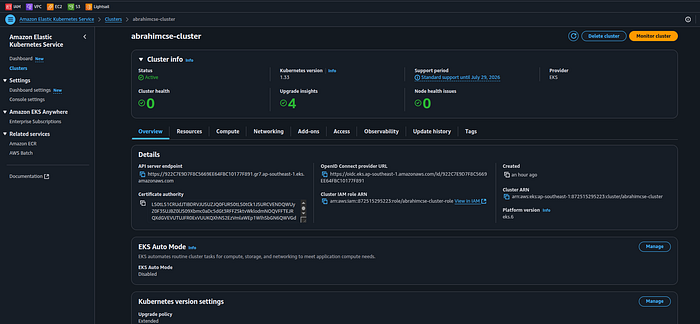
AWS EKS Cluster
Node Group
Press enter or click to view image in full size
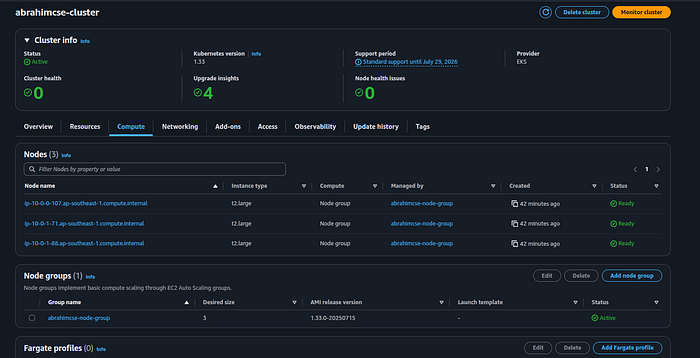
Node Group
5. RBAC Setup (Master Node)
Create cluster service account
user-1 , role-1 (cluster admin access)
user-2 , role-2 (good level of access)
user-3 , role-3 (read only access)
Create folder for RBAC
cd ..
mkdir rbac
cd rbac
Create Namespace
kubectl create ns webapps
Create Service Account
vi svc.yaml
apiVersion: v1
kind: ServiceAccount
metadata:
  name: jenkins
  namespace: webapps
kubectl apply -f svc.yaml
Create Role
vi role.yaml
apiVersion: rbac.authorization.k8s.io/v1
kind: Role
metadata:
  name: app-role
  namespace: webapps
rules:
  - apiGroups:
        - ""
        - apps
        - autoscaling
        - batch
        - extensions
        - policy
        - rbac.authorization.k8s.io
    resources:
      - pods
      - secrets
      - componentstatuses
      - configmaps
      - daemonsets
      - deployments
      - events
      - endpoints
      - horizontalpodautoscalers
      - ingress
      - jobs
      - limitranges
      - namespaces
      - nodes
      - pods
      - persistentvolumes
      - persistentvolumeclaims
      - resourcequotas
      - replicasets
      - replicationcontrollers
      - serviceaccounts
      - services
    verbs: ["get", "list", "watch", "create", "update", "patch", "delete"]
kubectl apply -f role.yaml
Bind Role to Service Account
vi bind.yaml
apiVersion: rbac.authorization.k8s.io/v1
kind: RoleBinding
metadata:
  name: app-rolebinding
  namespace: webapps
roleRef:
  apiGroup: rbac.authorization.k8s.io
  kind: Role
  name: app-role
subjects:
- namespace: webapps
  kind: ServiceAccount
  name: jenkins
kubectl apply -f bind.yaml
Create Secret to Get Service Account Token
vi sec.yaml
apiVersion: v1
kind: Secret
type: kubernetes.io/service-account-token
metadata:
  name: mysecretname
  annotations:
    kubernetes.io/service-account.name: jenkins
kubectl apply -f sec.yaml -n webapps
Collect Token and save into jenkins credential
kubectl describe secret mysecretname -n webapps
Create Secret for Docker Registry (DockerHub)
kubectl create secret docker-registry regcred \
  --docker-server=https://index.docker.io/v1/ \
  --docker-username=abrahimcse \
  --docker-password=<your_dockerhub_password> \
  --docker-email=abrahimcse@gmail.com \
  --namespace=webapps
To verify the secret:
kubectl get secret regcred --namespace=webapps --output=yaml
Check kubeconfig Info
cd ~/.kube
ls
cat config
✅ Use server: IP from this config if needed in deployment-service.yaml or Jenkins setup.
Others Server Ready
1. SonarQube Server Setup
Step 1: Install Docker and Enable Rootless Mode
sudo apt update
curl -fsSL https://get.docker.com -o get-docker.sh
sudo sh get-docker.sh
sudo apt-get install -y uidmap
dockerd-rootless-setuptool.sh install
Step 2: Run SonarQube Docker Container
docker run -d --name Sonar -p 9000:9000 sonarqube:lts-community
Access SonarQube:
http://<server_ip>:9000/Default Credentials:
Username:
adminPassword:
admin
Overview
Press enter or click to view image in full size
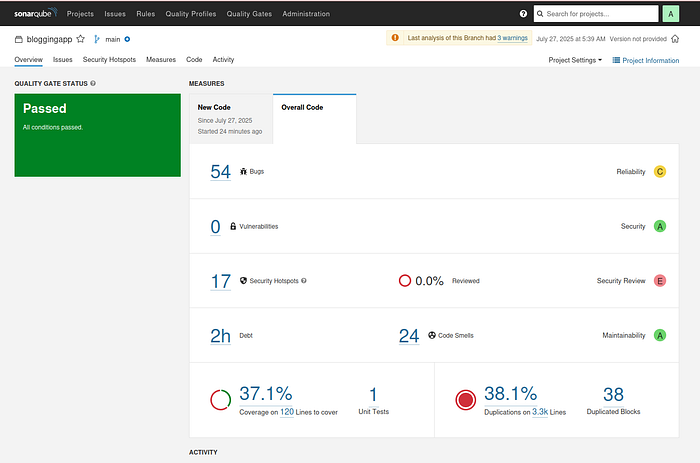
Quality Status : Overview
Issues
Press enter or click to view image in full size
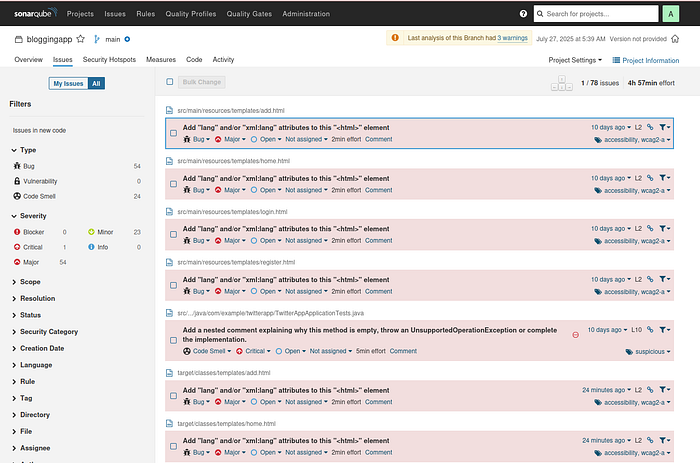
Issues
Step 3: Generate Authentication Token
Go to:
**Administration > Security > Users > Tokens**Create a new token:
- Name:
sonar-token
3. Click Generate and copy the token
Press enter or click to view image in full size
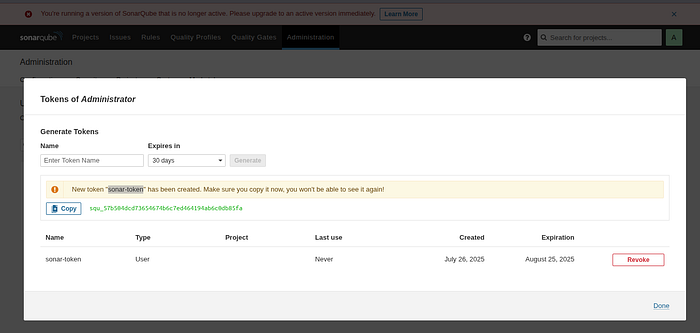
sonar-token
Step 4: Configure Webhook for Jenkins
Navigate to:
**Administration > Configuration > Webhooks**Click Create Webhook
Name:
jenkinsURL:
http://<jenkins_public_ip>:8080/sonarqube-webhook/
📌 Note: Ensure Jenkins is reachable from SonarQube server.
Press enter or click to view image in full size
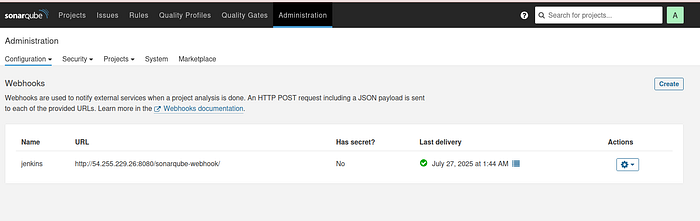
Webhook
2. Nexus Server
Step 1: Install Docker and Enable Rootless Mode
sudo apt update
curl -fsSL https://get.docker.com -o get-docker.sh
sudo sh get-docker.sh
sudo apt-get install -y uidmap
dockerd-rootless-setuptool.sh install
Step 2: Run Nexus Docker Container
docker run -d --name Nexus -p 8081:8081 sonatype/nexus3
Step 3: Retrieve Admin Password
docker ps
docker exec -it <container id> sh
cat sonatype-work/nexus3/admin.password
Access Nexus:
http://<server_ip>:8081/Username: admin
Password: (copy from the file above)
***check Enable anonymous access***(if needed for testing or open read access)
Browser
maven-releases (copy)
maven-snapshots (copy)
Press enter or click to view image in full size
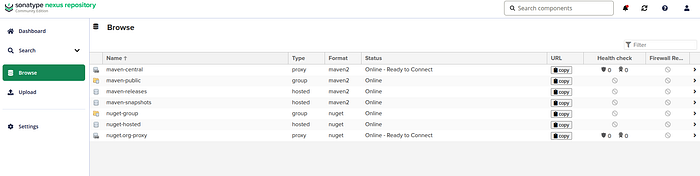
maven browse
Step 4: Update Your Maven pom.xml
Modify your pom.xml file with the Nexus repository endpoints:
<distributionManagement>
        <repository>
            <id>maven-releases</id>
            <url>http://13.212.202.251:8081/repository/maven-releases/</url>
        </repository>
        <snapshotRepository>
            <id>maven-snapshots</id>
            <url>http://13.212.202.251:8081/repository/maven-snapshots/</url>
        </snapshotRepository>
    </distributionManagement>
3. Jenkins Server Setup (CI/CD Pipeline with SonarQube, Nexus, Docker, Kubernetes)
Step 1: Install Docker (with Rootless Mode)
sudo apt update
curl -fsSL https://get.docker.com -o get-docker.sh
sudo sh get-docker.sh
sudo apt-get install -y uidmap
dockerd-rootless-setuptool.sh install
Verify Docker:
docker --version
Step 2: Install Trivy (Security Vulnerability Scanner)
vim trivy.sh
Paste into trivy.sh:
#!/bin/bash
sudo apt-get install wget gnupg
wget -qO - https://aquasecurity.github.io/trivy-repo/deb/public.key | gpg --dearmor | sudo tee /usr/share/keyrings/trivy.gpg > /dev/null
echo "deb [signed-by=/usr/share/keyrings/trivy.gpg] https://aquasecurity.github.io/trivy-repo/deb generic main" | sudo tee -a /etc/apt/sources.list.d/trivy.list
sudo apt-get update
sudo apt-get install trivy -y
Run script:
sudo chmod +x trivy.sh
./trivy.sh
trivy --version
Step 3: Install Jenkins (Debian/Ubuntu)
vim jenkin.sh
Paste into jenkin.sh:
#!/bin/bash
# Install OpenJDK 17 JRE Headless
sudo apt install openjdk-17-jre-headless -y
# Download Jenkins GPG key
sudo wget -O /usr/share/keyrings/jenkins-keyring.asc \
  https://pkg.jenkins.io/debian-stable/jenkins.io-2023.key
# Add Jenkins repository to package manager sources
echo deb [signed-by=/usr/share/keyrings/jenkins-keyring.asc] \
  https://pkg.jenkins.io/debian-stable binary/ | sudo tee \
  /etc/apt/sources.list.d/jenkins.list > /dev/null
# Update package manager repositories
sudo apt-get update
# Install Jenkins
sudo apt-get install jenkins -y
Run it:
chmod +x jenkin.sh
./jenkin.sh
Access Jenkins:
URL:
http://<server_ip>:8080Initial password:
sudo cat /var/lib/jenkins/secrets/initialAdminPassword
Press enter or click to view image in full size
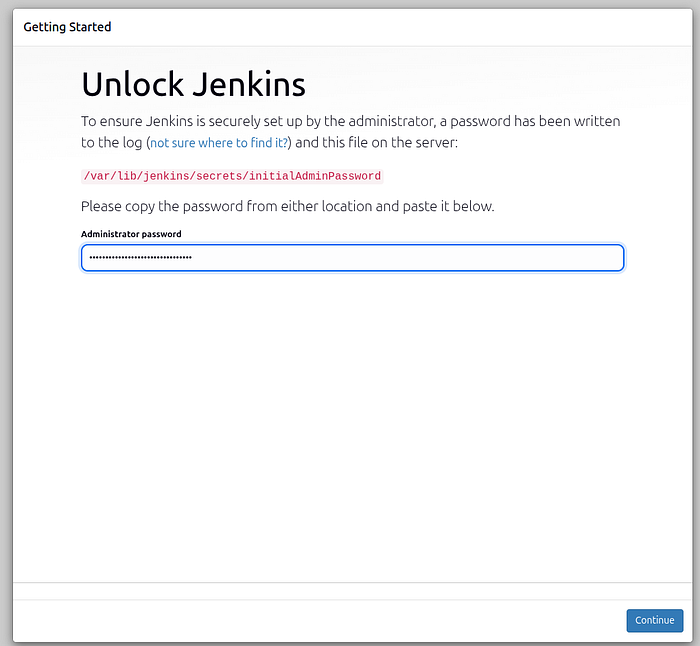
Unlock Jenkins
Press enter or click to view image in full size
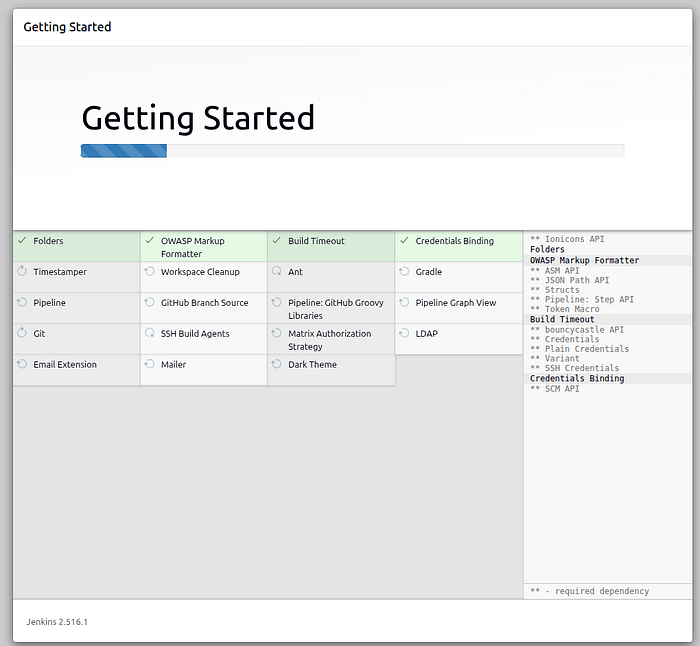
Getting Started
Press enter or click to view image in full size
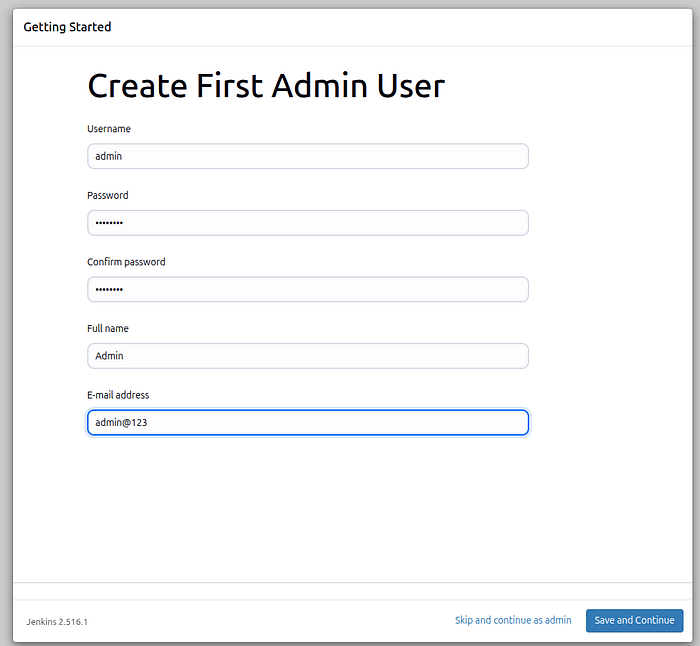
Admin User Create
Press enter or click to view image in full size
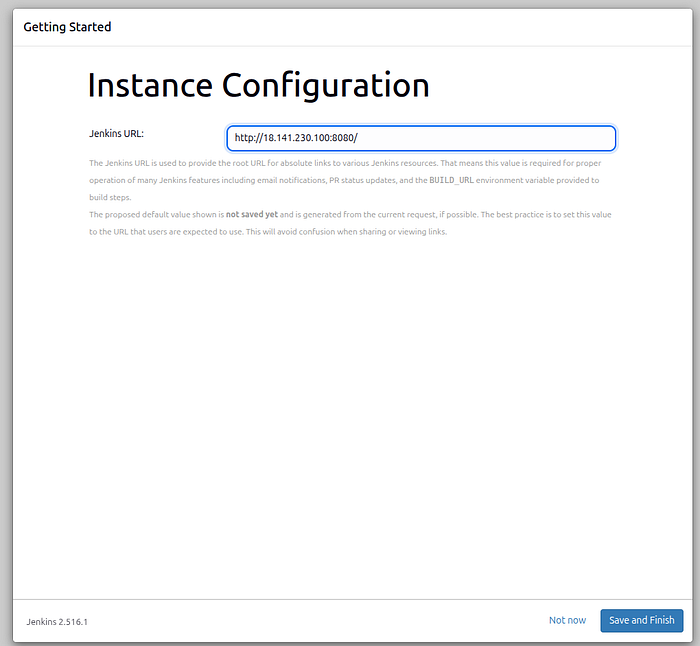
Configurations
Step 4: Install kubectl on Jenkins Server
vi kubelet.sh
Paste into kubelet.sh
#!/bin/bash
curl -o kubectl https://amazon-eks.s3.us-west-2.amazonaws.com/1.19.6/2021-01-05/bin/linux/amd64/kubectl
chmod +x ./kubectl
sudo mv ./kubectl /usr/local/bin
kubectl version --short --client
Run it:
chmod +x kubelet.sh
./kubelet.sh
Step 5: Add Jenkins to Docker Group
sudo usermod -aG docker jenkins
sudo systemctl restart jenkins
Jenkins Configuration
Step 6: Install Required Plugins
Navigate: Dashboard > Manage Jenkins > Plugins > Available Plugins
Get Abdur Rahim’s stories in your inbox
Join Medium for free to get updates from this writer.
Subscribe
Install:
✅ Docker ✅ Docker Pipeline ✅ Kubernetes ✅ Kubernetes CLI ✅ Kubernetes Client API ✅ Kubernetes Credentials ✅ Prometheus Metrics ✅ Pipeline: Stage View ✅ Pipeline Maven Integration ✅ Maven Integration ✅ SonarQube Scanner ✅ Config File Provider ✅ Eclipse Temurin installer
📝 Restart Jenkins after plugin installation.
Press enter or click to view image in full size
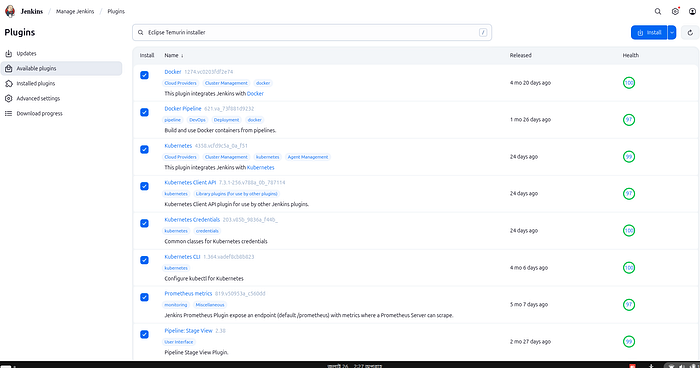
Plugins
Step 7: Global Tool Configuration
Navigate: Dashboard > Manage Jenkins > Tools
JDK:
Name:
jdk17Check “Install automatically”
Source:
Adoptium.netVersion:
jdk-17.0.9+9

JDK
SonarQube Scanner:
Name:
sonar-scannerVersion:
latest
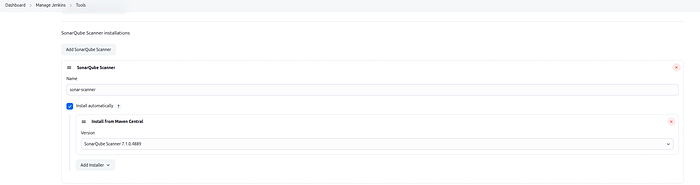
SonarQube Scanner
Maven:
Name:
maven3Version:
3.6.1
Press enter or click to view image in full size

Maven
Docker:
Name:
dockerInstall Automatically
Step 8: Credentials Setup
Navigate: Manage Jenkins > Credentials > System > Global > Add Credentials
github
username :
guthub-usernamepass :
github-tokenID :
git-credDescription :
git-cred
Sonarqube
Kind :
secret textsecret:
generated token(sonar-token)ID :
sonar-tokenDescription :
sonar-token
Docker Hub
username:
dockerhub_usernamepass :
dockerhub_passwordID :
docker-credDescription :
docker-cred
K8s-Cluster
Kind :
secret textsecret:
token(kubectl describe secret mysecretname -n webapps)ID :
k8-credDescription :
k8-cred
Gmail Notification
Kind : Username with password
Username :
abrahim.ctech@gmail.comPassword:
<Gmail App Password>ID :
mail-credDescription :
mail-cred
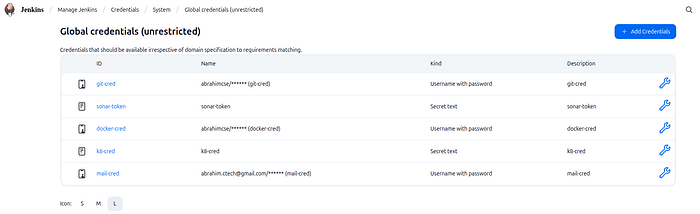
Credentials
Step 9: Add Maven Settings File (for Nexus)
Navigate: Manage Jenkins > Managed Files > Add a New Config
Type: Global Maven settings.xml
ID:
global-settings
Paste:
<settings>
  <servers>
    <server>
      <id>maven-releases</id>
      <username>nexus_username</username>
      <password>nexus_password</password>
    </server>
    <server>
      <id>maven-snapshots</id>
      <username>nexus_username</username>
      <password>nexus_password</password>
    </server>
  </servers>
</settings>
Step 10: Add SonarQube Server Info
Navigate: Manage Jenkins > System > SonarQube Servers
Name:
sonarServer URL:
http://<sonar_server_ip>:9000Token:
sonar-token(from credentials)
Step 11: Create a New Pipeline Job
➤ Create Job
Go to Jenkins Dashboard
Click
New ItemName:
BoardGameType:
PipelineClick
OK
➤ Basic Configuration
Discard Old Builds:
Max # of builds:
2Pipeline Definition:
Choose:
Pipeline script
pipeline {
    agent any

    stages {
        stage('Hello') {
            steps {
                echo 'Hello World'
            }
        }
    }
}
➤ Jenkins Declarative Pipeline Syntax (GUI to Script Mapping)
Pipeline Syntax
Sample Step git : Git
Repository URL : github url
Branch : main
Credential : select id
git branch: 'main', credentialsId: 'git-cred', url: 'https://github.com/abrahimcse/Boardgame.git'
Sample Step withSonarQubeEnv: Prepare SonarQube Scanner environment
server token : sonar-token
withSonarQubeEnv(credentialsId: 'sonar-token') {
}
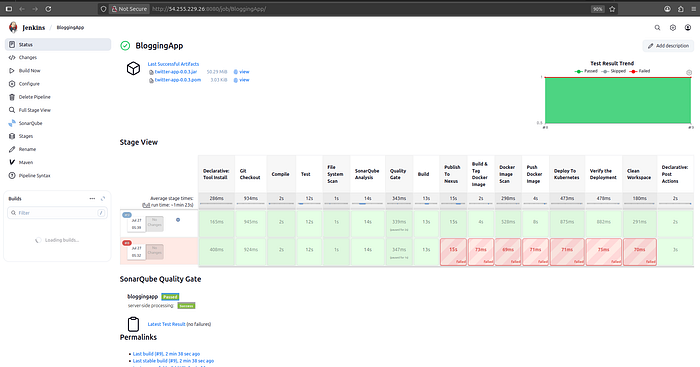
JenkinsPipeline Configuration
Here’s a quick visual stage flow from your pipeline for clarity:
Git Checkout →
Compile →
Unit Test →
Trivy Scan →
SonarQube Analysis →
Quality Gate Check →
Build JAR →
Deploy to Nexus →
Docker Image Build →
Push to DockerHub
Deploy to Kubernetes →
Verify the Deployment →
Pipeline code in
Jenkinsfilemodify on your requirments
Pipeline Stages
Press enter or click to view image in full size
Pipeline Stages
📧 Jenkins Email Notification Setup (Gmail SMTP)
You’ll configure Jenkins to send email notifications using Gmail’s SMTP service.
Step 1: Generate Gmail App Password
Navigate to:
Security→2-Step Verification→ Enable it (if not already)Scroll down to
App Passwords
3. Select:
App:
MailDevice:
Jenkins(or any name) password:
✅ Copy the generated password (you’ll use this in Jenkins configuration)
Step 2: Configure Jenkins Email Notification
Go to Jenkins: manage jenkins > system
1. Extended E-mail Notification
SMTP server: smtp.gmail.com
SMTP POrt : 465
🔽 Click on Advanced
Check Use SSL
✅ Add Credentials:
Kind : Username with password
Username :
abrahim.ctech@gmail.comPassword :
<Gmail App Password>ID :
mail-credSelect the added credential :
abrahim.ctech@gmail.com(mail-cred)
2. E-mail Notification
- SMTP Server:
smtp.gmail.com
🔽 Click Advanced
✅ Check Use SSL
SMTP Port: 465
✅ Check Use SMTP Authentication
Username:
abrahim.ctech@gmail.comPassword:
<Gmail App Password>
3. Test the Configuration
Scroll down to the Test configuration section
Enter your email:
abrahim.ctech@gmail.comClick Test Configuration
You should receive a test email if everything is configured properly.
Press enter or click to view image in full size
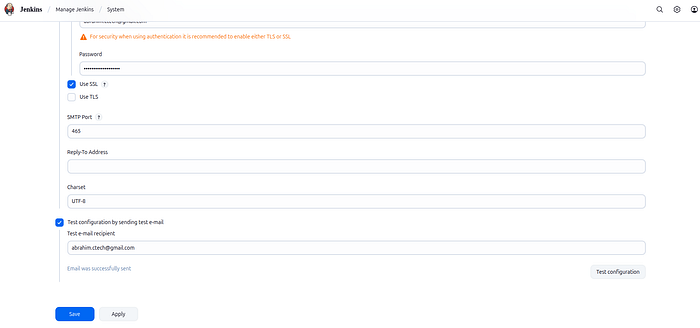
Test Configuration
Monitoring Setup: Prometheus + Grafana + Exporters
Ensure your system is updated first:
sudo apt update -y
Step 1: Install Prometheus
wget https://github.com/prometheus/prometheus/releases/download/v3.5.0-rc.0/prometheus-3.5.0-rc.0.linux-amd64.tar.gz

ls
tar -xvf prometheus-3.5.0-rc.0.linux-amd64.tar.gz
rm -rf prometheus-3.5.0-rc.0.linux-amd64.tar.gz
mv prometheus-3.5.0-rc.0.linux-amd64 prometheus
cd prometheus
ls
./prometheus &
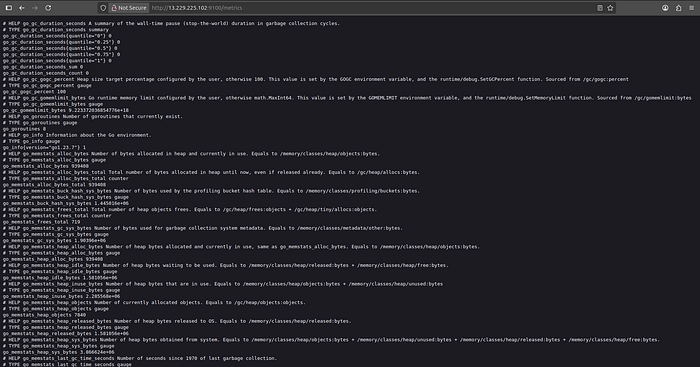
🌐 Access Prometheus: http://<public_ip>:9090
Step 2: Install Grafana
sudo apt-get install -y adduser libfontconfig1 musl
wget https://dl.grafana.com/enterprise/release/grafana-enterprise_12.0.2_amd64.deb
sudo dpkg -i grafana-enterprise_12.0.2_amd64.deb

sudo systemctl start grafana-server
🌐 Access Grafana: http://<public_ip>:3000 👤 Default Login:
Username:
adminPassword:
admin
Press enter or click to view image in full size
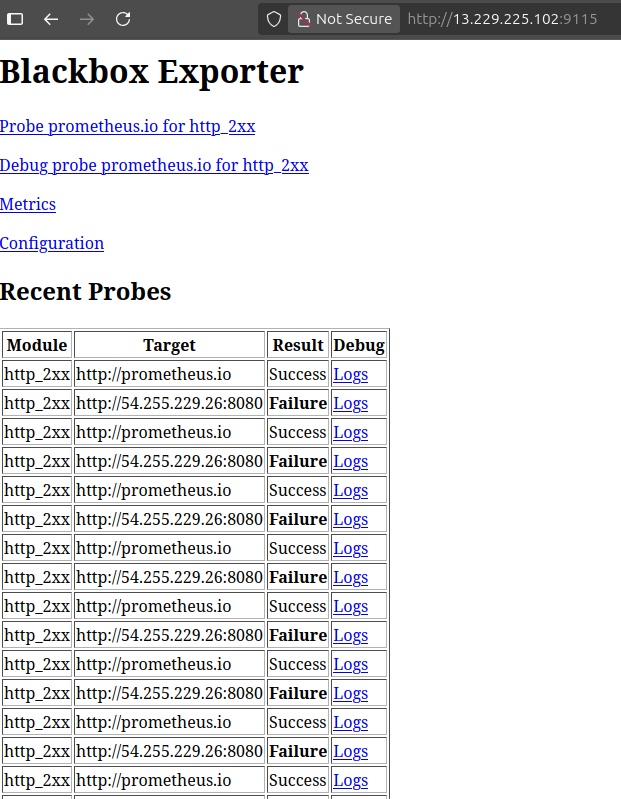
Step 3: Setup Blackbox Exporter
wget https://github.com/prometheus/blackbox_exporter/releases/download/v0.27.0/blackbox_exporter-0.27.0.linux-amd64.tar.gz
tar -xvf blackbox_exporter-0.27.0.linux-amd64.tar.gz
rm -rf blackbox_exporter-0.27.0.linux-amd64.tar.gz
mv blackbox_exporter-0.27.0.linux-amd64 blackbox_exporter
cd blackbox_exporter
ls ./backbox_exporter &
🌐 Access Blackbox Exporter: http://<public_ip>:9115
Configure prometheus.yml to include Blackbox:
cd ~/prometheus
vim prometheus.yml
Add the following job:
- job_name: 'blackbox'
    metrics_path: /probe
    params:
      module: [http_2xx]  # Look for a HTTP 200 response.
    static_configs:
      - targets:
        - http://prometheus.io    # Target to probe with http.
        - http://example.com:8080 # Target to probe with http on port 8080.
    relabel_configs:
      - source_labels: [__address__]
        target_label: __param_target
      - source_labels: [__param_target]
        target_label: instance
      - target_label: __address__
        replacement: 127.0.0.1:9115  # The blackbox exporter's real hostname:port.
Restart Prometheus:
pgrep prometheus
kill id
./prometheus &
Step 4: Install Node Exporter (on Jenkins server)
wget https://github.com/prometheus/node_exporter/releases/download/v1.9.1/node_exporter-1.9.1.linux-amd64.tar.gz
ls
tar -xvf node_exporter-1.9.1.linux-amd64.tar.gz
ls
rm rf node_exporter-1.9.1.linux-amd64.tar.gz
mv node_exporter-1.9.1.linux-amd64.tar.gz node_exporter
cd node_exporter
ls
./node_exporter &
Press enter or click to view image in full size
🌐 Node Exporter Port: http://<jenkins_server_ip>:9100
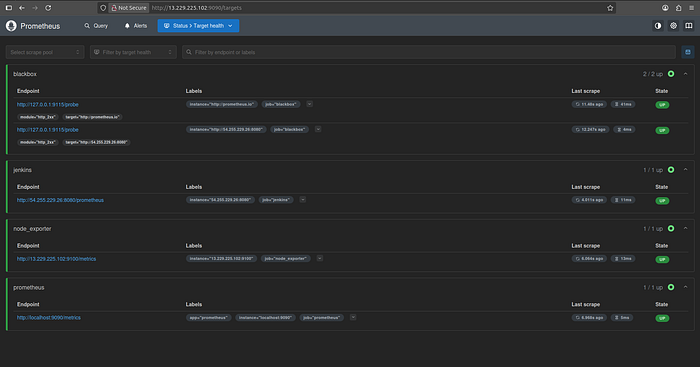
Add Node Exporter and Jenkins Job to prometheus.yml
cd prometheus
ls
vim prometheus.yml
- job_name: 'node_exporter'
    static_configs:
      - targets: ['<jenkins_server_ip>:9100']

- job_name: 'jenkins'
    metrics_path: /prometheus
    static_configs:
      - targets: ['<jenkins_server_ip>:8080']
Restart Prometheus:
pgrep prometheus
kill id
./prometheus &
Step 5: Connect Grafana with Prometheus
Go to Grafana UI:
Grafana > Connections > Data sources > Add data sourceSelect Prometheus from the list.
Fill in the details:
Name:
Prometheus(or any preferred name)URL:
http://<PROMETHEUS_SERVER_IP>:9090
Scroll down and click Save & Test.
You should see a message like: Data source is working.
Step 6: Import Dashboards
Navigate to:
Dashboard > ImportPaste one of the dashboard IDs listed below.
Click Load.
Select your Prometheus data source.
Click Import to finish.
Dashboard Name Dashboard ID
🔍 Blackbox Exporter
7587🖥️ Node Exporter
1860
Grafana Blackbox
Press enter or click to view image in full size
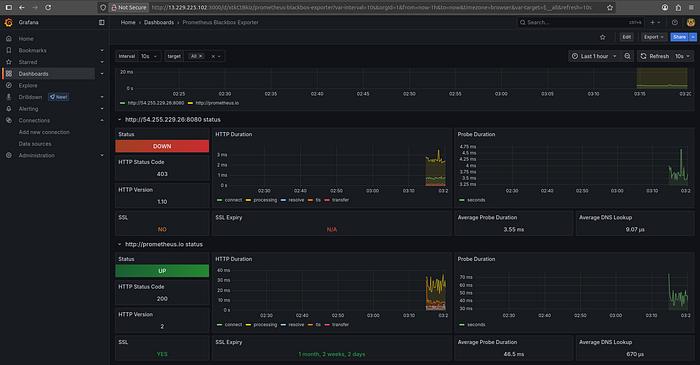
Grafana Blackbox
Grafana NodeExporter
Press enter or click to view image in full size
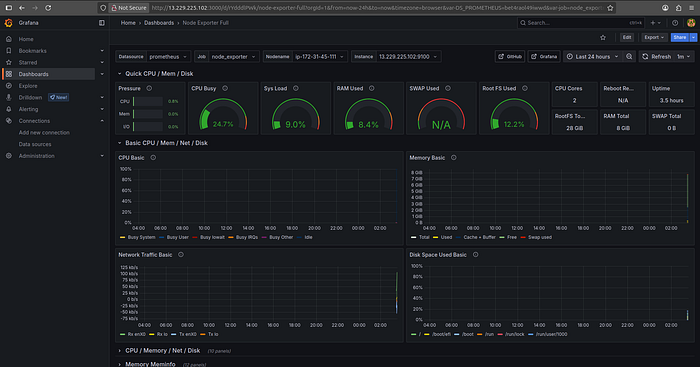
Grafana NodeExporter
📖 Conclusion
This project is not just a simple CRUD FullStack Blogging Application — it’s a complete DevOps CI/CD journey packaged with real tools used in production. Ideal for portfolio, enterprise POCs, and DevOps learners who want to understand how real-world systems run.
🛠️ Author & Community
This project is crafted by Harshhaa 💡.
I’d love to hear your feedback! Feel free to share your thoughts.
📧 Connect with me:
![]()
📢 Stay Connected
